access data that offers transparency into return-to-work times, claims costs, and outlier cases.

Worker Injury Recovery
Save time and reduce costs with optimized workers’ compensation recovery solutions
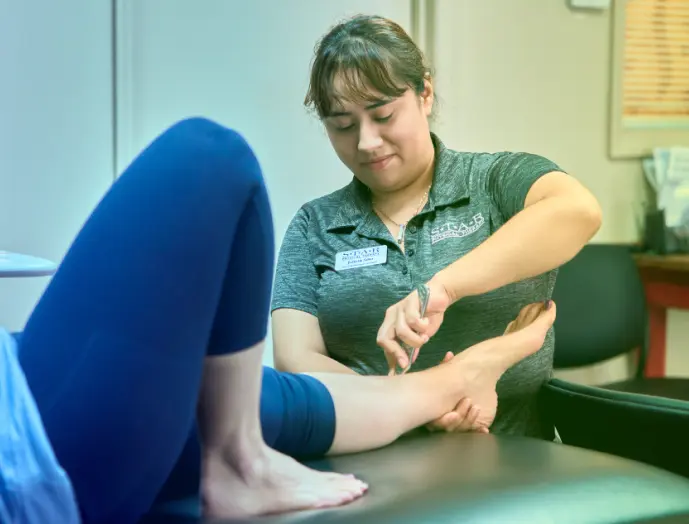
Your national PT/OT partner for recovery
An outcomes-based workers’ compensation platform, Bardavon combines a nationwide network of highly curated outpatient therapy providers with a concierge patient management service to improve injured workers claims experience. Ongoing collaboration with our stakeholders informs treatment decisions, guides in-clinic and at-home recovery, and improves return-to-work results.

Personalized Recovery
Personalized care and an SMS, text-based coaching platform guides workers towards faster return-to-work times with tips that can keep them healthy when back on the job.
Clinical Oversight
Our workers’ compensation software connects key stakeholders throughout the recovery process and informs clinical teams of risks to recovery to personalize treatment plans, focusing on early intervention to avoid outlier cases.
Quality Care
With shared insights, employers, case managers, adjusters, providers and physicians stay informed and make better recovery decisions.
How it works
Our empathetic approach assures injured workers receive personalized support and timely care from intake to discharge, accelerating treatment with individualized clinical oversight, which in turn optimizes claims outcomes and reduces costs for our clients.
NATIONAL PROVIDER NETWORK
Quickly treat injured workers
Our workers’ compensation platform is directly contracted with 40,000+ leading outpatient therapy providers, guiding best practices and delivering exceptional care to 94% of the U.S. workforce.


PATIENT MANAGEMENT
Concierge Customer Service
Each payor is assigned a dedicated customer success team that comprehensively manages each injured worker’s case throughout recovery.
CLINICAL OVERSIGHT
A specialist at every step
Trained clinicians leverage case-specific data to support each of our stakeholders with optimizing and improving patient care.
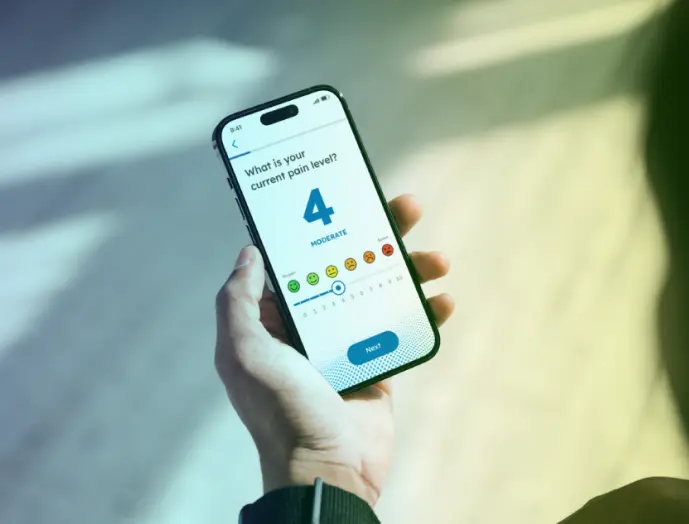
INJURED WORKER ENGAGEMENT
Creating better treatment outcomes
With Recovery+, our experienced, in-house clinicians engage directly with injured workers through an SMS-based program to offer personalized claims support.
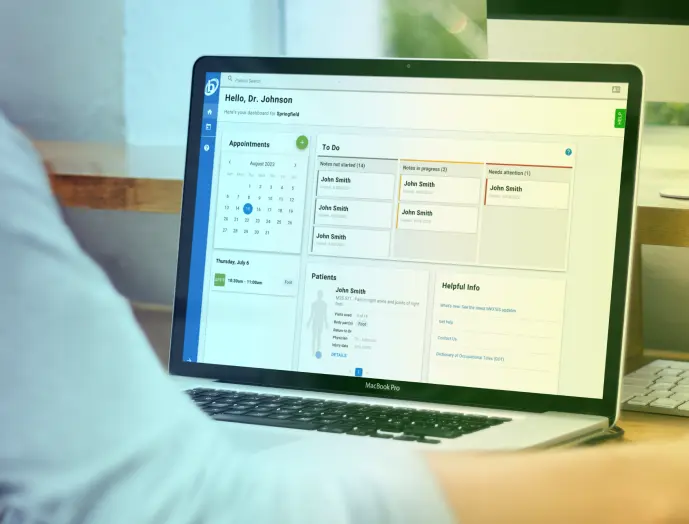
ACTIONABLE RECOVERY DATA
Make informed decisions
On-demand, near real-time access to case-specific insights, creating transparency amongst stakeholders to optimize treatment protocols.
Who benefits?
manage total risk and therapy spend with predicative analytics and optimized care.
receive an individualized care plan that gets them healthy and keeps them healthy.
can prioritize workload with data that guides informed decisions.
can establish a plan of care with real-time data that drives decision making and improves outcomes.
What’s your ROI?
Reduce medical expenses with an efficient care pathway and data-backed decision-making.
Save on the number of visits
Efficient, personalized therapy and our technology suite reduces the number of required visits.
Indemnity savings
Tech-empowered care improves case outcomes and the return to full-duty work.
Avoid costly cases
Reduce complications and costly outliers with data insights and earlier interventions.
Settlement savings
Closely managed care plans prove levels of function that can reduce settlement costs.
Compliment in-clinic care with Recovery+
Our licensed clinicians engage with injured workers between on-site rehab visits to improve recovery outcomes.
Connect today.
Complete the form below to connect with our team and learn how our Bardavon solutions can benefit your workplace.